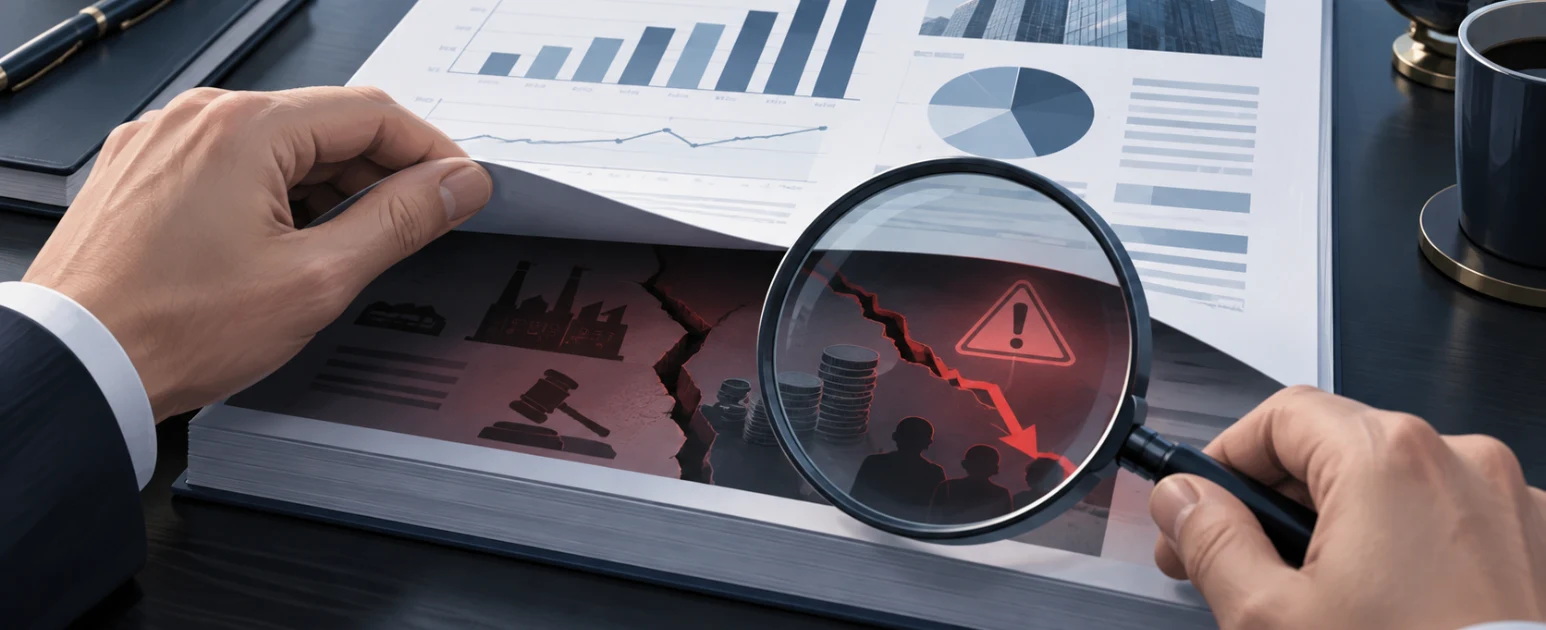
A company’s annual report can look impressive at first glance. Revenue is growing. Profits are increasing. The future looks promising.
But the real risks are often hidden behind those headline numbers. A closer look at the financial statements, cash flow, footnotes, and auditor’s report can reveal warning signs that investors should not ignore.
Annual reports’ red flags are signs that a company’s financial health, reporting quality, or business decisions may need further review. Common warning signs include weak cash flow, rising debt, declining margins, unusual accounting changes, and unclear disclosures.
This guide explains the key annual report red flags every investor should check. It covers the warning signs found in income statements, balance sheets, cash flow statements, auditor reports, and governance disclosures.
What Are Red Flags in an Annual Report?
Red flags in annual reports are warning signs that may indicate potential financial, operational, or governance risks within a company.
An annual report provides a detailed view of a company’s financial position, business performance, strategy, and risks. Reviewing these details helps investors understand whether reported growth is supported by strong fundamentals.
Common annual report red flags include:
- - Profits increasing while operating cash flow declines
- - Debt growing faster than business performance
- - Revenue growth slowing over time
- - Frequent accounting policy changes
- - Unusual related-party transactions
- - Auditor concerns
- - Management explanations that do not match financial results
These signals do not automatically mean a company is performing poorly or engaging in misconduct. They highlight areas where further analysis is needed.
Strong analysis usually comes from identifying patterns across multiple years rather than reacting to one isolated number.
Red Flags in the Income Statement
The income statement shows how a company generates revenue and profit, but investors need to examine the quality and sustainability of those earnings.
Strong revenue numbers do not always mean strong business performance. The following warning signs deserve closer attention.
Declining Profit Margins
Falling profit margins can indicate rising costs, pricing pressure, or weakening operating efficiency.
Profit margins show how much profit a company keeps after covering different expenses. A consistent decline may suggest that the business is becoming less efficient or losing competitive strength.
Investors should review:
- - Gross margin trends
- - Operating margin changes
- - Cost increases
- - Pricing pressure
A temporary margin decline may happen because of market conditions or investment in growth. However, a long-term decline requires further investigation.
Slowing or Stalling Revenue Growth
Slowing revenue growth can indicate weaker demand, increased competition, or challenges in the company’s market.
Revenue growth is important, but the source and quality of that growth matter. Investors should understand whether sales are increasing because of sustainable business expansion or temporary factors.
Potential warning signs include:
- - Revenue growth slowing year after year
- - Declining sales in key segments
- - Lower customer demand
- - Reduced future growth expectations
Comparing annual reports over several years helps identify whether growth is improving or weakening.
One-Time Gains Making Profits Look Stronger
One-time gains can make reported profits appear healthier than the company’s core operations actually are.
Companies may record gains from asset sales, investments, or other non-recurring events. These can increase earnings for a specific period but may not represent ongoing business strength.
Check whether profits are mainly coming from:
- - Normal business operations
- - Asset sales
- - Investment gains
- - Unusual accounting adjustments
A company that repeatedly depends on one-time gains may have weaker underlying earnings quality.
Red Flags in the Balance Sheet
The balance sheet shows a company’s financial position, including its assets, liabilities, and shareholder equity.
Investors should review whether the company’s assets are healthy and whether its liabilities remain manageable.
Accounts Receivable Growing Faster Than Sales
Rising accounts receivable can indicate slower customer payments or potential pressure on cash collection.
Accounts receivable represents money customers owe for products or services already provided. Growth is normal when sales increase, but receivables rising much faster than revenue may require attention.
Possible warning signs include:
- - Sales increasing without similar cash collection
- - Longer payment periods from customers
- - Weakening operating cash flow
Investors should compare receivable growth with revenue trends over multiple reporting periods.
Rising Debt Without Matching Business Growth
Increasing debt can become a risk when a company’s cash generation cannot support its financial obligations.
Debt can help companies expand and invest in growth. The concern appears when borrowing increases without matching business improvement.
Review:
- - Total debt levels
- - Interest expenses
- - Debt-to-equity ratio
- - Operating cash flow
Debt levels should always be considered within the company’s industry because acceptable leverage varies between sectors.
Rapidly Increasing Goodwill After Acquisitions
Rapid goodwill growth can indicate that acquisitions may not be delivering the expected value.
Goodwill is created when a company pays more for an acquisition than the fair value of the acquired assets. It reflects expectations about future benefits from that deal.
Investors should examine:
- - Acquisition history
- - Goodwill growth
- - Performance of acquired businesses
- - Potential impairment risks
Goodwill itself is not a problem. The concern arises when acquired businesses fail to generate the expected returns.
Inventory Growing Faster Than Sales
Rising inventory levels can indicate weaker demand, inefficient stock management, or slower product movement.
Some inventory growth is normal when a business expands. However, inventory increasing much faster than sales may suggest that products are not moving as expected.
Review:
- - Inventory growth compared with revenue growth
- - Inventory turnover trends
- - Changes in demand
This red flag is especially relevant for businesses that rely heavily on physical products.
Red Flags in the Cash Flow Statement
The cash flow statement shows whether reported profits are converting into actual cash.
Cash generation often provides a clearer picture of business strength because companies need cash to operate, invest, and manage obligations.
Profits Rising While Operating Cash Flow Falls
A gap between increasing profits and declining operating cash flow can indicate weaker earnings quality.
Net income includes accounting adjustments, while operating cash flow shows cash generated from normal business activities.
Review:
- - Net income trends
- - Operating cash flow trends
- - Changes in working capital
Consistent differences between profit and cash generation deserve further investigation.
Shrinking Free Cash Flow
Declining free cash flow can reduce a company’s ability to invest, repay debt, or return capital to shareholders.
Free cash flow represents the cash remaining after operating expenses and capital investments.
A falling trend may result from:
- - Higher costs
- - Large capital requirements
- - Lower operational efficiency
Investors should examine whether declining free cash flow is temporary or part of a longer pattern.
Auditor Report Red Flags Investors Should Check
The auditor’s report provides an independent assessment of a company’s financial statements. It can highlight areas where investors need more information before evaluating the company.
Qualified Opinion or Going Concern Warning
A qualified opinion or going concern warning requires careful review because it may indicate financial reporting or operational concerns.
A qualified opinion means the auditor identified an issue affecting part of the financial statements. A going concern warning indicates uncertainty about the company’s ability to continue operating normally.
Investors should read the auditor’s explanation instead of relying only on the opinion label.
Frequent Auditor Changes
Frequent auditor changes may require additional review, especially when combined with reporting concerns.
Companies may change auditors for normal reasons. However, sudden changes should be understood through company disclosures and official explanations.
Management and Governance Red Flags
Management commentary and governance disclosures show how company leaders communicate risks and make decisions. Investors should compare management statements with actual financial results.
Changing Management Explanations or Business Strategy
Changing explanations or unclear communication from management can be a warning sign when reviewing an annual report.
Investors should compare the latest annual report with previous years to check whether management’s statements match actual business performance. A company may adjust its strategy over time, but major changes should come with clear explanations.
Pay attention to:
- - Missed targets without clear reasons
- - Sudden changes in business priorities
- - Previous goals disappearing from new reports
- - Management avoiding specific explanations about challenges
Related-Party Transactions and Insider Dealings
Related-party transactions require careful review because they involve connections between the company and insiders. These transactions are not automatically problematic, but investors should understand their purpose and terms.
Check:
- - Who is involved
- - Why the transaction exists
- - Whether it benefits shareholders
Executive Pay Rising While Performance Falls
High executive compensation during weak company performance can raise questions about alignment between management rewards and shareholder outcomes.
Review executive pay alongside:
- - Revenue performance
- - Profit trends
- - Stock performance
- - Company targets
How to Verify Annual Report Red Flags Before Investing
Potential red flags need context before investors draw conclusions. Reviewing historical financial data and notes to financial statements helps determine whether an issue is temporary or part of a larger pattern.
Compare Several Years of Financial Data
Look for trends rather than single-year changes. Compare:
- - Revenue growth
- - Profit margins
- - Debt levels
- - Operating cash flow
- - Free cash flow
A single change may not indicate a serious problem. Repeated patterns across multiple years can reveal deeper risks.
Review Footnotes for Hidden Risks
Important details behind financial numbers are often explained in the notes section.
- - Pay attention to:
- - Accounting policy changes
- - Lawsuits and regulatory issues
- - Debt commitments
- - Related-party transactions
- - Asset valuation assumptions
Common Mistakes Investors Make When Reviewing Annual Reports
Investors often focus on headline financial numbers and miss important details. Common mistakes include:
- - Looking only at revenue growth
- - Ignoring cash flow
- - Skipping financial statement notes
- - Treating one metric as the complete picture
- - Assuming every warning sign means fraud
A complete review requires understanding how different parts of the annual report connect.
Annual Report Red Flag Checklist Before You Invest
Bottom Line
To sum up, red flags in annual reports help investors spot possible risks before they go deeper into a company’s performance. Things like weak cash flow, rising debt, falling margins, and unclear disclosures deserve a closer look.
Actually, a single red flag does not tell the whole story. The key is to understand why it appears and whether it continues over time. Reviewing financial statements, footnotes, and management explanations can help investors build a clearer view of a company’s financial health.
Need faster access to company filings? Access annual reports and corporate filings API in one place. Use our standardized API to speed up research and analysis. You can check out the pricing or feel free to contact us.
Frequently Asked Questions
What is the biggest red flag in an annual report?
A major red flag is when a company reports rising profits but its operating cash flow is falling. Other warning signs include increasing debt, audit concerns, and unusual financial disclosures.
Can a profitable company still have red flags?
Yes. A profitable company can still have problems such as weak cash flow, rising debt, accounting issues, or governance concerns.
How many red flags mean I should avoid a stock?
There is no fixed number of red flags that applies to every company. Investors should look at the severity of each issue and whether it continues over time.
Are auditor changes always a bad sign?
No. Companies may change auditors for normal reasons. However, frequent or unexpected changes combined with reporting concerns need closer review.
Do annual report red flags always mean fraud?
No. Red flags do not always mean fraud. They are warning signs that may point to financial risks, reporting issues, or business challenges.
Which sections of an annual report should investors check first?
Investors should start with the financial statements, auditor’s report, and notes to financial statements. These sections usually contain the most important financial information and risks.
Where can investors find red flags in an annual report?
Investors can find red flags in financial statements, footnotes, auditor reports, management discussions, and governance disclosures.